
On a sweltering August day in Boston, you may find yourself strolling along a street with lengthy stretches of bare sidewalk. As you walk, the sun beats down from above and heat reflects off the buildings and pavement around you. Like any city dweller, you draw on your best speedwalker abilities and dash to the next patch of tree-lined pavement — a necessary respite from the heat, but all too brief.
This everyday discomfort is the result of the urban heat island effect. Urban heat islands are found in areas where large portions of the natural greenery — trees, grass and shrubbery — have been replaced with urban infrastructure. Because building materials like asphalt and metal tend to retain more heat than greenery, cities are typically much warmer than nearby suburbs and rural areas.
These warmer conditions can have serious negative health effects for people who live within heat islands. And health risks are only amplified by side effects of heat islands, like increased air pollution and poor water quality.
Heat islands are one speciality of Dan O’Brien, director of the Boston Area Research Initiative (BARI) and a professor of public policy and urban affairs at Northeastern. O’Brien uses granular data to better understand urban phenomena and serve impacted communities.
He says that communities themselves know best how to serve their residents, but that researchers can leverage data to bolster community-led initiatives and policy lobbying.
“It’s one thing to go to a legislator and say ‘our community is suffering from extreme heat.’ It’s another thing to have a map,” says O’Brien.
Microspatial inequities
Though climate scientists have long recognized a correlation between where you live and how you are affected by climate change, O’Brien’s research looks at this pattern on a new scale.
“If you want to leverage the precision of our modern data most effectively, you have to be paying attention to those lower, very highly localized scales. Because that’s where the action is,” O’Brien explains.
In 2020, O’Brien and a team of researchers published a study in the American Journal of Public Health that observed land surface temperature of streets within Boston neighborhoods. They found that differences in temperature persisted within neighborhoods — not only across them, as had been previously reported. These “microspatial inequities,” as O’Brien calls them, mean some streets are more prone to heat-related health risks than others.
Even though the South End may be generally more shady than East Boston, that doesn’t mean every block within it is. And the people on hotter blocks are at higher risk for heat cramps, heat exhaustion and heat stroke.
O’Brien and his team attribute street level differences to urban processes and infrastructure — like vehicular traffic, and urban canopy from trees or buildings. These are the same driving factors of climate inequities between neighborhoods but now observable on an even smaller scale.
“The whole literature up to that point had been about neighborhoods … but it wasn’t that the neighborhood is hot. It was that the neighborhood is a place with hot streets,” says O’Brien. “You’re not being affected by the entire neighborhood. You’re being affected by what’s on your front porch.”
Climate comorbidities
In 2021, O’Brien partnered with Amy Mueller, an associate professor in civil and environmental engineering at Northeastern, for a study published in the journal Sustainability that delved deeper into microspatial inequities. Their goal was to determine where heat islands and other environmental hazards exist at the street level in Boston.
They used previously developed databases of urban heat islands and air pollutant emissions to measure environmental hazards. To observe street-level patterns, they used BARI’s Geographical Infrastructure for Boston, which breaks the city down into street segments — essentially blocks — gathered from census data.
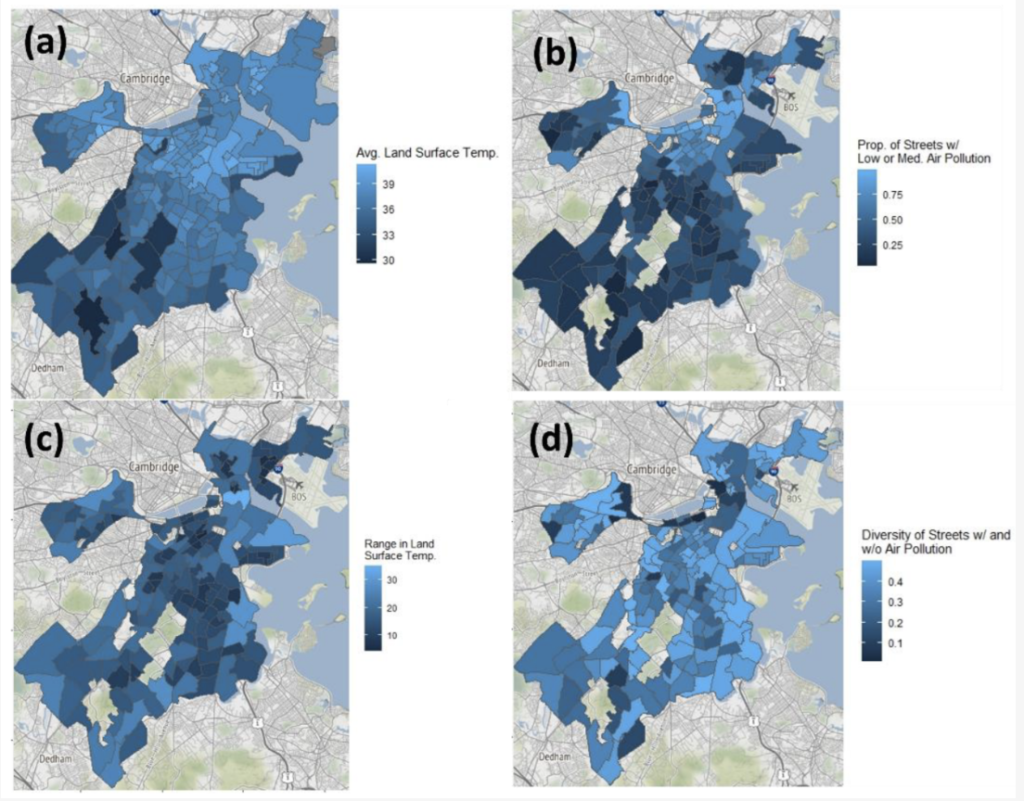
Similar to O’Brien’s previous study, this analysis showed varying land surface temperature and air pollution levels within neighborhoods, not just across them (Figure 1).
But something else surprised them. While many streets had high land surface temperatures and many had air pollution, they were not always on the same streets (Figure 2).
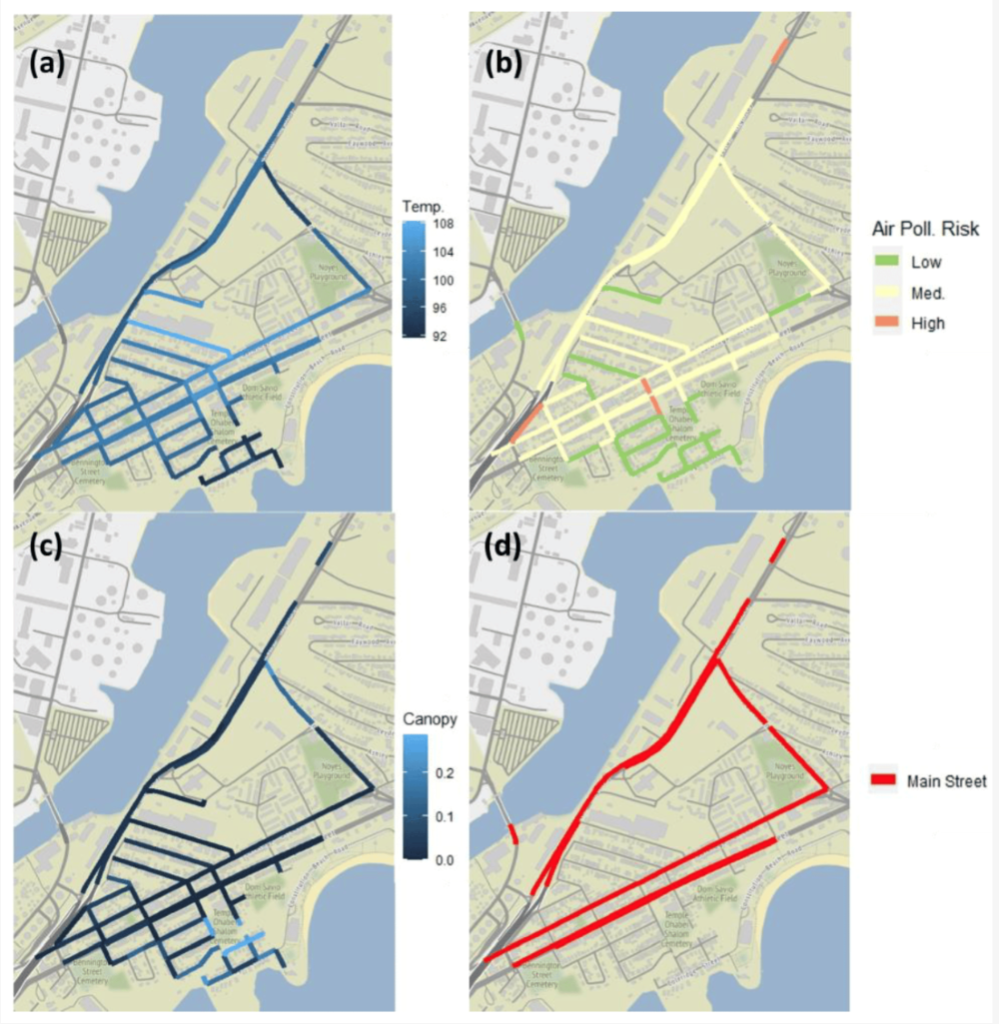
The study showed that the existence of one environmental hazard did not guarantee the presence of others on the neighborhood or street level.
“That’s actually really valuable because it tells you that, okay, you’re exposed to one hazard — that doesn’t guarantee that you’re exposed to the other hazards. And that’s a new thing,” says O’Brien.
Street-level differences impact people’s lived experiences, so more nuanced environmental justice initiatives are needed to equitably address these disparities within neighborhoods, says O’Brien.
Bringing it all together
These studies appear in O’Brien’s forthcoming book from MIT Press, The Pointillistic City, which also features previous research about microspatial inequities in crime. The book’s final section will expand on these findings and explore how to co-design solutions for intra-neighborhood disparities with community members. O’Brien recognizes this final portion as a key contribution of his book.
“Anything that a scientist discovers or asks about communities should be relevant to the people who live in, work in and serve those communities,” says O’Brien.
O’Brien and Mueller have partnered with researchers across colleges at Northeastern to transform their street-by-street map into an online tool that visualizes climate hazards faced by Boston neighborhoods. They will share the final product with local community groups like Dudley Street Neighborhood Initiative and Project R.I.G.H.T Inc, to help them address environmental inequities in their neighborhoods. This project is being done in collaboration with the iSuper Impact Engine which is working with the cities of Chelsea and Brookline as well.
O’Brien explains that this tool is a vital step in his research process, as it’s important for researchers to maintain a connection to the communities they study.
“The work is as much about trust as it is about the science,” he says. “You can have great insights on data, but you need to develop a relationship with the community if you’re going to contribute — if you’re going to do something that is worth anything to them.”
Story from the Science Media Lab.
Last Updated on October 13, 2023